
Published Home Office statistics tell you how many visas were granted, not how likely yours is. The most recent release covers the year ending June 2026. This page sets out what it actually shows, how to read the underlying tables yourself, and why the country-by-country “success rates” circulating online should be treated with care.
Statistics
UK Visa Grant Rates and What the Data Shows
The Headline Figures
In the year ending June 2026, 727,487 non-visitor and non-transit visas were granted — 15% fewer than the previous year, with the fall split almost evenly between work visas (down 51,000) and study visas (down 49,000).
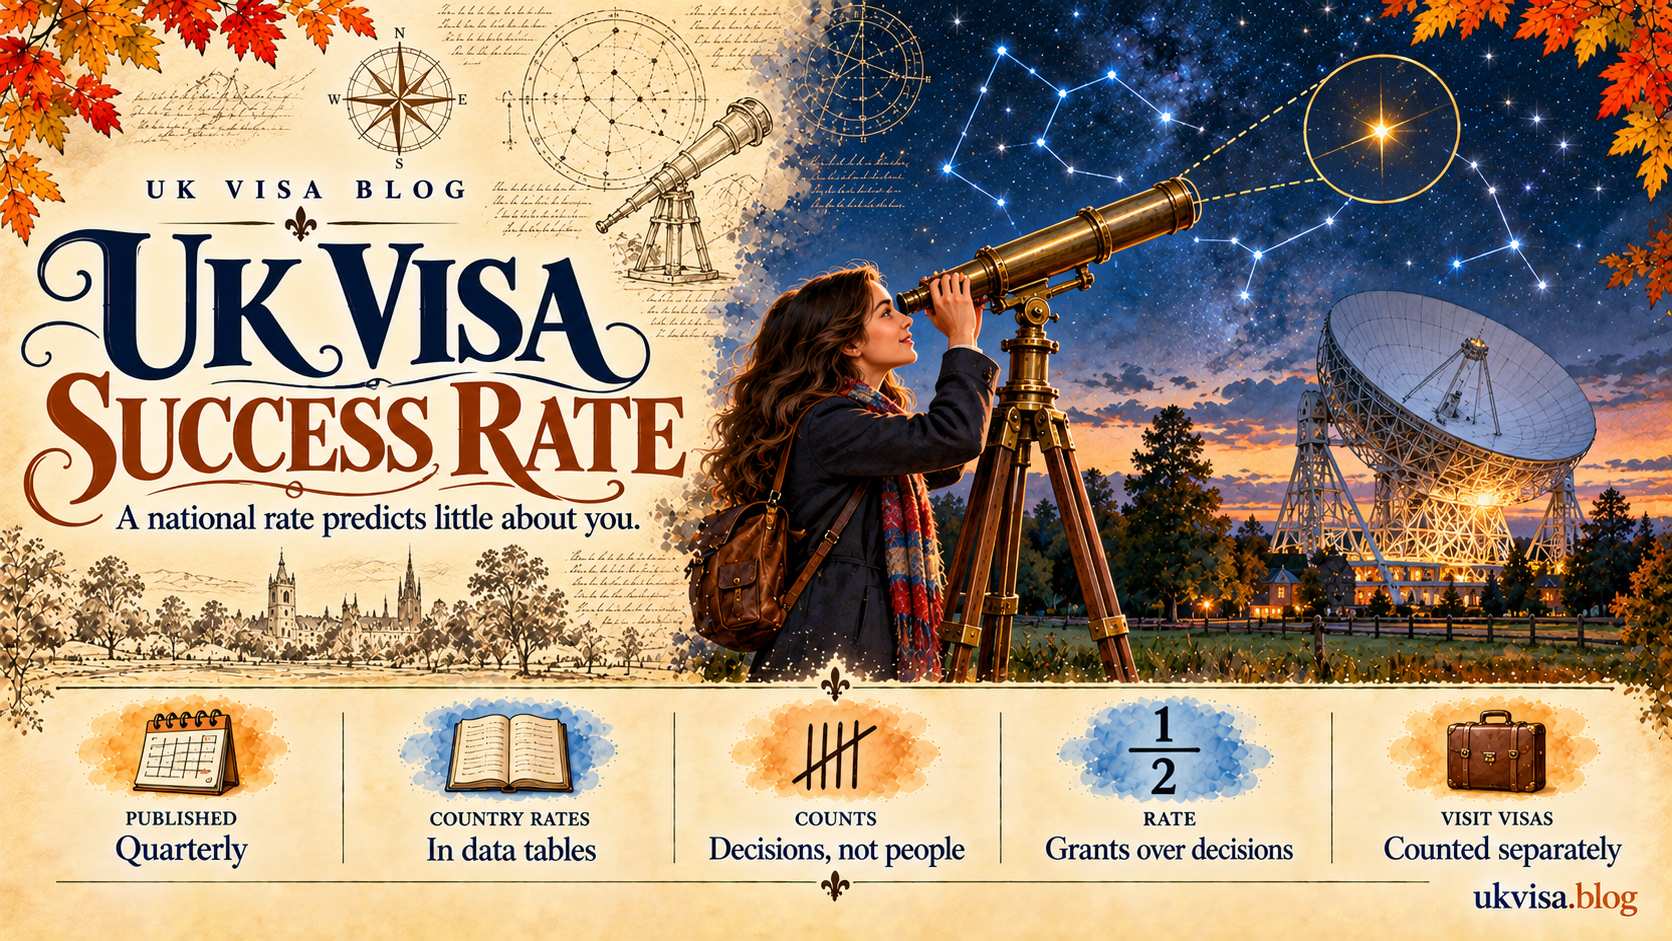
Year ending June 2026: 727,487 non-visitor and non-transit visas granted, down 15%. Study accounted for 385,974, work 234,841, family 57,590 and other categories 49,082. Visit and transit visas are counted separately and are far larger in volume. Grant rates by nationality are published in the quarterly data tables rather than in the headline release.
Grants by Category, Year Ending June 2026
| Category | Grants |
|---|---|
| Study | 385,974 |
| Work | 234,841 |
| Family | 57,590 |
| Other | 49,082 |
| Total, excluding visit and transit | 727,487 |
Source: Home Office immigration system statistics, year ending June 2026. Checked 22 August 2026.
Country-Level Data
Grant rates by nationality are not in the headline commentary. They sit in the quarterly data tables, which give applications, decisions, grants, refusals and withdrawals by nationality, route and quarter. Working a rate out means dividing grants by decisions for the specific route and period you care about.
Figures shared on forums and content sites are frequently stale, drawn from a different quarter, computed on a different denominator, or mixed across routes. Before relying on any national grant rate, check which release it comes from, which route it covers, and whether the denominator is applications or decisions.
Why a National Rate Predicts Little About You
A national figure aggregates people with nothing in common except a passport — different routes, different circumstances, different quality of evidence. Two applicants of the same nationality applying on the same day can face very different outcomes, and the published rate describes neither of them.
Grants Are Not the Same as People
One person can generate several grants in a year — an entry clearance, then an extension, then a dependant’s application on the same household. The published totals count decisions, not individuals, so reading them as a headcount of arrivals overstates the number of people involved.
The same caution applies in reverse. A fall in grants can reflect fewer applications, more refusals, a rule change taking effect, or a processing backlog moving volume between quarters. The headline number tells you what was issued; it does not tell you why.
Which Release to Use
Statistics are published quarterly, each release covering a rolling year. The year ending June 2026 release is the current one, and it supersedes earlier years rather than supplementing them. Comparing a figure from one release against a figure from another without checking the periods is the commonest error in circulated analysis.
Visit Applications
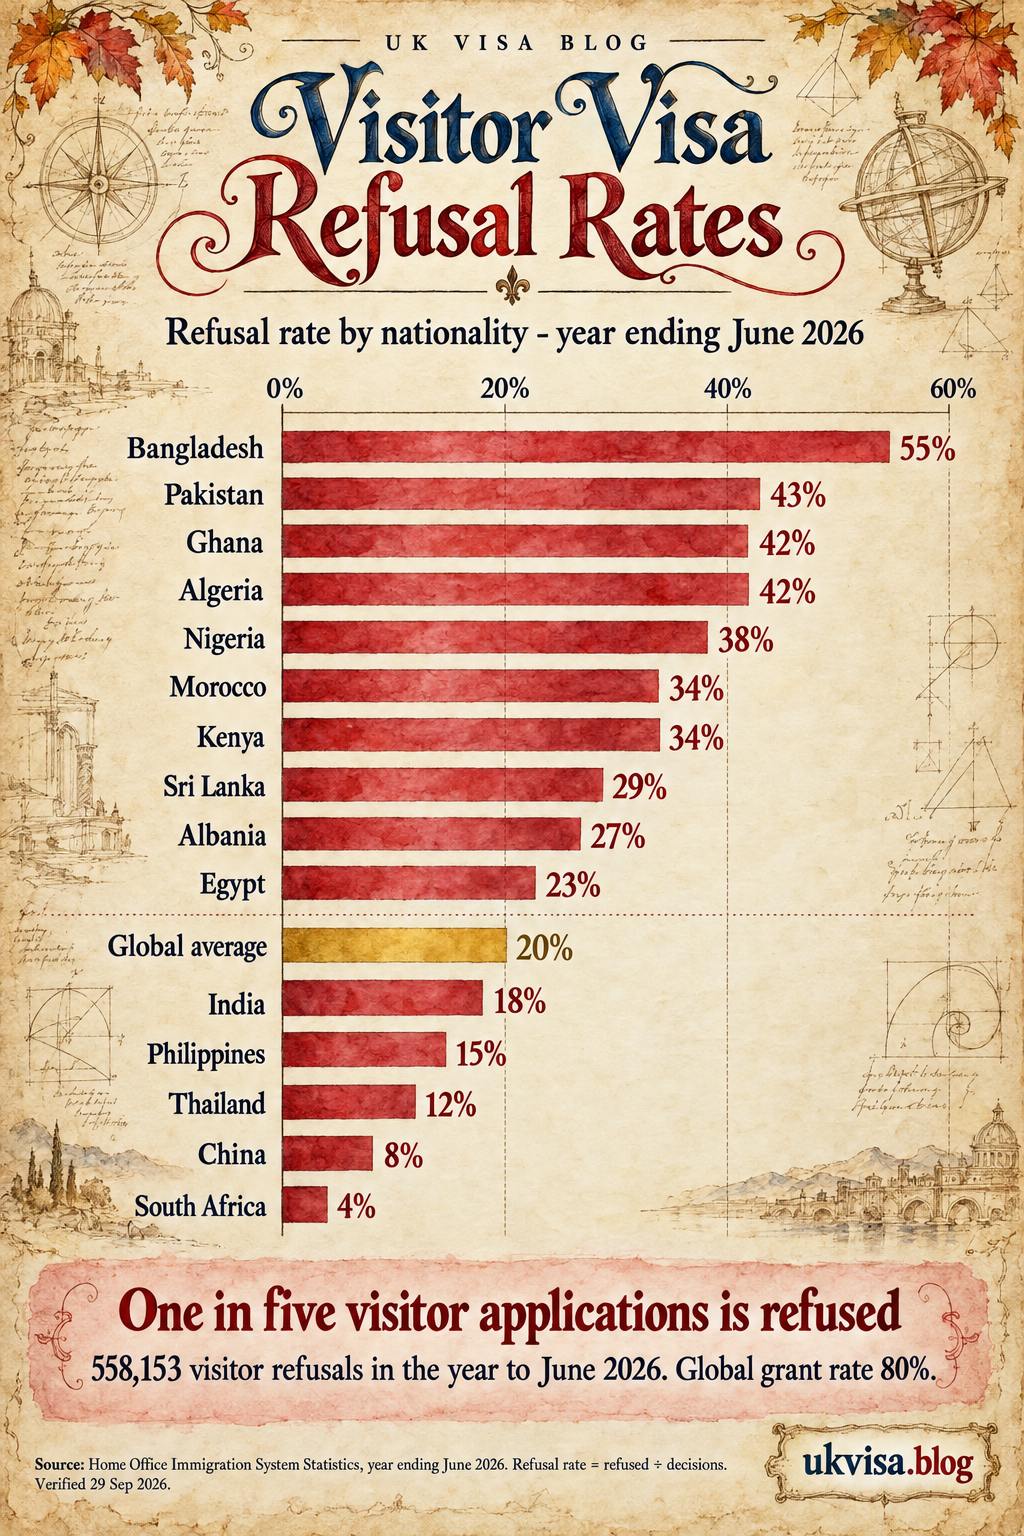
Visit and transit visas are counted separately from the 727,487 figure and are much larger in volume, because they cover short trips rather than migration. Their outcomes are driven by the genuine visitor test: whether you will leave, whether you are living here through repeated visits, whether the purpose is permitted, and whether you have sufficient funds.
That is why visit refusal patterns are more informative than visit refusal rates. Our pages on the standard visitor route and refusal grounds set out what caseworkers actually cite.
Study Applications
Study is the largest single category at 385,974 grants in the year ending June 2026. Study refusals concentrate on a small number of requirements: the confirmation of acceptance, the maintenance funds and how long they have been held, and English at the required level.
Those are documentary rather than evaluative, which is why study applications with correct paperwork tend to succeed. See our pages on the student route and its financial requirements.
Reading the Data for One Country
- Open the entry clearance visa applications and outcomes tables: in the quarterly data tables collection.
- Filter to your nationality and route: visit, study, work or family, not the total.
- Use decisions as the denominator: grants divided by decisions, excluding withdrawals.
- Pick a whole year, not a quarter: quarterly figures swing on seasonal patterns.
- Note the release date: and compare like with like across years.
Doing this yourself takes minutes and gives a figure you can date and defend. It is also the only way to see the base numbers, which matter — a 60% rate on 200 decisions means something very different from the same rate on 200,000.
The “Success Rate From India” Question
The most-searched version of this question — the UK visitor visa success rate from India in 2026 — has no single official answer, which is why every site quotes a different number. India’s figure comes out of the same quarterly tables by the method above, and it moves with the mix of first-time and repeat travellers applying each quarter. Any page quoting one static percentage for the year is estimating, not reporting.
Family Applications
Family accounted for 57,590 grants in the year ending June 2026 — the smallest of the four categories and, in practice, the most evidence-intensive. Refusals concentrate on the financial requirement and on the genuineness of the relationship.
Family is also the category where a right of appeal most often exists, because a refusal engages human rights. See our pages on the spouse route and on appealing a spouse refusal.
Work Applications
Work grants fell to 234,841, an 18% drop that accounts for close to half of the overall decline. Work refusals turn on the certificate of sponsorship, the occupation code, the salary against both the threshold and the going rate, and the sponsor’s own standing.
Those are largely decided before the application is submitted, by the employer. See our page on the Skilled Worker route for what has to be right at the certificate stage.
Why Work Is the Volatile Category
Work grants respond faster to policy than any other category, because they depend on employer behaviour as well as applicant behaviour. A change to salary thresholds, occupation eligibility or the cost of sponsorship changes what employers do next month, not next year, and the grant figures follow within a quarter or two.
Study behaves differently, being tied to academic cycles and to institutions’ recruitment. Family is the steadiest of the four, because it reflects relationships rather than markets. Reading a fall in the total without separating those dynamics attributes to one cause what is really three.
Settlement
Settlement outcomes are not reported as a headline grant rate, and the reason is instructive: most refusals turn on countable things. Absences over the permitted limit, a gap in continuous residence, a missing Life in the UK pass, or an English certificate at the wrong level.
Each of those can be checked before applying, which is why the £3,226 fee should never be paid on an unchecked application. See our pages on settlement and settlement processing times.
Settlement Volume Follows Earlier Grants
Settlement numbers lag the routes that feed them by five years, so a peak in work or family grants shows up as a peak in settlement applications half a decade later. That lag is why settlement volumes can rise in a year when new grants are falling, and why neither figure explains the other.
Citizenship
Citizenship refusals cluster on good character and on absences. The good character guidance changed on 10 February 2025 so that applications including illegal entry will normally be refused regardless of when the entry occurred, which has affected a defined group of applicants who were previously granted settlement without difficulty.
Absences are the other recurring failure: 450 days across five years, 270 across three on the spouse route, and 90 in the final twelve months. Both are checkable in advance — see our page on naturalisation requirements.
Reviews and Appeals
Tribunal statistics for the first quarter of 2026 show 39% of immigration appeals allowed overall — 44% for human rights appeals, 40% for asylum and 30% for EEA cases. The mean time from lodging to determination was 61 weeks, and 71 weeks for human rights cases.
Where an immigration judicial review reached a substantive determination, the outcome favoured the appellant in around 41% of cases, though most claims never get past the permission stage. Administrative review succeeds far less often, for structural reasons: the test is case working error and new evidence is generally excluded — see our page on administrative review.
Withdrawals Distort the Picture
The tables report applications, decisions, grants, refusals and withdrawals separately. Dividing grants by applications rather than by decisions produces a lower figure, because withdrawn applications never reached a decision at all. That single choice of denominator explains much of the variation between competing published rates for the same country.
Use decisions. It answers the question an applicant actually has — of the cases that were decided, how many were granted — and it is the denominator the Home Office commentary uses when it discusses grant rates.
What Actually Improves Your Odds
- Consistency: every figure and date matching across the form, the evidence and any sponsor letter.
- Explained finances: statements showing the origin of funds, with any unusual deposit accounted for.
- Declared history: every previous refusal, from any country, with an explanation.
- A stay length that fits the purpose: credible against the activity described.
- The right documents, not more documents: leaving out the ones GOV.UK lists as less useful.
- The correct route: the commonest structural error is applying on a route that cannot deliver what you want.
None of these is visible in a national statistic, and all of them are decided by you. Our pages on reading a refusal letter and what to do after a refusal cover the position if the answer is no.
Sources: Home Office immigration system statistics, year ending June 2026, the immigration system statistics data tables, the quarterly release collection and published tribunal statistics for the first quarter of 2026. Figures verified 5 September 2026.
Frequently Asked
Success Rate Questions
How many UK visas were granted in the year to March 2026?
727,487 non-visitor and non-transit visas, 11% fewer than the previous year. Visit and transit visas are counted separately and are much larger in volume.
Which category is the largest?
Study, at 385,974 grants, followed by work at 234,841, other categories at 49,082 and family at 57,590.
Why did the total fall?
The Home Office attributes the 11% decline predominantly to fewer work visas being issued.
Where do I find the grant rate for my country?
In the quarterly data tables, not the headline release. Filter to your nationality and route, then divide grants by decisions for a whole year.
Can I rely on the country rates I see online?
Not without checking. They are often from a different quarter, a different route, or computed on a different denominator. Check the release, the route and the denominator before using one.
Does a low national rate mean I will be refused?
No. A national figure aggregates people who share only a passport. Your outcome turns on your route, your circumstances and your evidence.
What proportion of appeals succeed?
Around 39% were allowed in the first quarter of 2026, with human rights appeals at 44%, asylum at 40% and EEA cases at 30%.
How long does an appeal take?
The mean was 61 weeks to determination in early 2026, and 71 weeks for human rights appeals.
Why does administrative review succeed less often?
Because it tests for case working error rather than merits, and new evidence is generally not considered. That is a structural difference, not a reflection of case quality.
Do the figures count people or applications?
Decisions, not individuals. One person can generate several grants in a year, so reading the totals as a headcount of arrivals overstates the number of people.
Should I use applications or decisions as the denominator?
Decisions. Using applications includes cases that were withdrawn and never decided, which depresses the rate and is the main reason published country figures disagree with each other.
What single thing most improves an application?
Consistency. Figures and dates that match across the form, the evidence and any sponsor letter remove the most common reason a caseworker doubts an application.